Understanding Frequency Response Charts
Deciding on which studio monitor is likely to suit your needs and work well in your recording space is always best done by listening to a few different models. But pretty much every studio monitor is also accompanied by a technical spec and, if you know how to interpret them, technical specs can provide some useful background info.
The first specification that most people reach for when considering monitors is frequency response. Frequency response seems a simple concept; it defines a monitor’s bandwidth, in other words, the range of audio frequencies that the monitor is able to reproduce. But dig deeper and there’s a little more to it.
At first sight, the most important numbers in a frequency response spec would seem to be the minimum and maximum, but in fact, of rather more significance are the limits. The limits define how much quieter the monitor will be at its minimum and maximum frequencies. Some monitor manufacturers specify a limit of -3 dB, some -6 dB, some -10 dB, and some don’t define any limits at all, which means that their frequency response specifications are effectively meaningless. In the case of the ADAM Audio T Series and AX Series, the frequency response limits are defined at -10 dB; a choice reflecting that a 10 dB decrease in volume level subjectively sounds around half as loud.
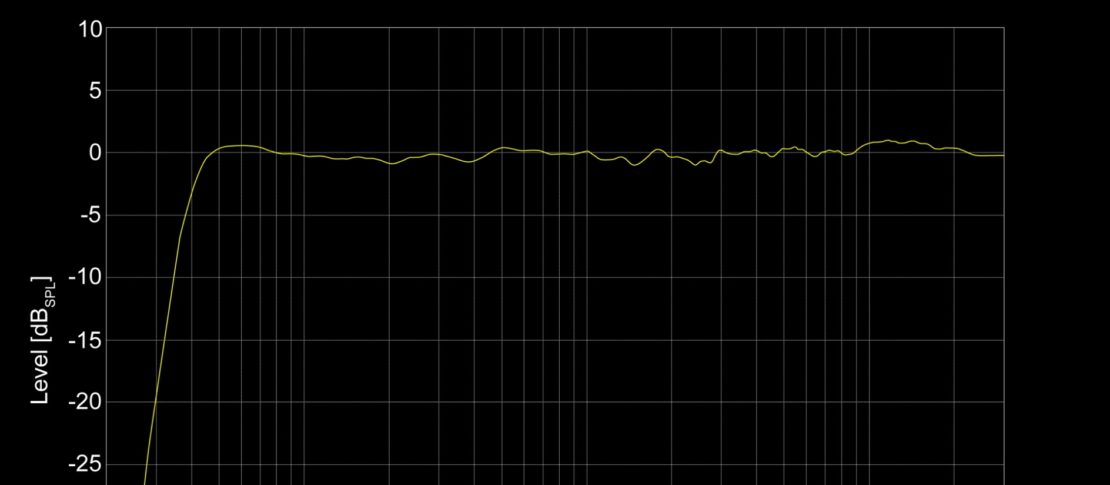
There is an alternative to specifying frequency response limits however (it’s one that we at ADAM Audio sometimes use), and that’s to publish a frequency response curve on which the bandwidth of the monitor can be clearly seen. Take the ADAM Audio T7V for example. The published frequency response spec is 39 Hz to 25 kHz and the accompanying frequency response curve illustrates that the volume level at those frequencies has fallen by approximately -10 dB. If you wanted to know however at what low frequency the T7V response falls to -3 dB, perhaps to compare with another monitor spec, it can be simply read from the graph. To save you the trouble on the T7V, it’s -3 dB @ 50 Hz.
Once you appreciate the importance of limits on a frequency response specification you can make more valid and worthwhile comparisons between different monitors. For example if you compare two monitor specs; one that quotes, say, 50 Hz to 20 kHz @-3 dB, and one that quotes 40 Hz to 22 kHz @ -10 dB, you’ll know that the first one, despite its apparently narrower range, probably has a wider -10 dB bandwidth. When you appreciate the importance of response limits also you’ll be able to identify frequency response specifications that perhaps look a little ambitious. For example, there’s numerous technical reasons why it’s difficult to extend the low frequency bandwidth of compact monitors (maybe we’ll cover that in a future blog post), so if you see a low frequency response specification of a compact monitor that seems unusually competitive, check the limits. And if there are no limits you can probably disregard the specification and move on.
A frequency response curve, like the one that accompanies the T7V, can of course tell you more about a monitor than just its overall bandwidth, but be wary though, because it’s also easy to assume too much about a monitor from the shape of the curve. That’s because, while it seems self-evident that the frequency response of a monitor should be flat, the shape of the curve not only depends on the specific position of the measuring microphone relative to the monitor drivers, it doesn’t include the influence of a listening room and the position of the monitors within.
But why, you might ask, do monitors not have a perfectly flat frequency response?
The comprehensive answer to that question is well beyond the scope of this blog post, but fundamentally the reason comes down to the sheer complexity of accurately converting an electronic audio signal with, potentially, a bandwidth of ten octaves (20 Hz to 20 kHz) into audible acoustic energy. We take monitors, and all other speakers, for granted these days but they always have presented significant engineering challenges on multiple fronts. One challenge is materials science.
That requirement for 10 octaves bandwidth means that driver diaphragms large and stiff enough to move significant volumes of air at low frequencies also have to be light and rigid enough to accurately track complex musical signals oscillating at up to twenty thousand times every second. There are very few materials available with the combination of light weight and rigidity that are able to fulfill the role, so compromises have to be made and they’re reflected in frequency response curves that are hardly ever perfectly flat – regardless of how much you’re willing to spend on monitors.

By loading the video, you agree to YouTube's privacy policy.
Learn more

![Understanding Phase Response Charts [Part 2]](https://www.adam-audio.com/blog/wp-content/uploads/resized/2025/05/adam-audio-blog-learn-understanding-phase-response-diagram-part2-thumbnail-300x200-c-default.jpg)